Back
Back
Back


Back
Back
Back
Best Sellers

No Odor
Green Label Singapore

Fres
Easy to clean with water

Avitex Eksterior
Green Label Singapore

Boyo Plamir
More economical

No Drop
Waterproof

Aries Gold
Fast Drying

Aries Cat Tembok
Fast Drying

Sunguard
Green Label Singapore

Supersilk
Green Label Singapore

Everglo

Aquamatt
Green Label Singapore

Avitex Alkali Resisting Primer
Green Label Singapore

No Drop Bitumen
Fast Drying

Absolute Roof Coating
Easy to clean with water

Avitex Cat Genteng & Seng
Best Coverage

Belmas Roof

Yoko Cat Genteng & Seng
Color doesn't fade easily

Lem Putih VIP PVAc

Avian Roadline Paint
Fast Drying

Wood-Eco Woodstain Water Based
Green Label Singapore

Boyo Politur Vernis Solvent Based
Anti-fungal & Anti-insect

Tan Politur

Avian Hammertone
Best Coverage

Suzuka Cat Duco Otomotif
Fast Drying

Viplas
Leakproof

VIP Paint Remover

Avian Anti Fouling

Avian Lem Epoxy Super
Unscented

Avian Non-Sag Epoxy Super
Unscented
Giant Mortar 220 - Plamir Instan
For Interior & Exterior

Giant Mortar 260 - Acian Abu-abu
Without Putty/Filler
Giant Mortar 270 - Acian Putih
For Interior & Exterior
Giant Mortar 380 - Perekat Bata Ringan
Strong Adhesion
Giant Mortar 480 - Perekat Keramik Dinding Di atas Keramik
Prevents Ceramic Tiles from Lifting

Avian Cat Kayu dan Besi
For Interior & Exterior

Yoko Cat Kayu & Besi
For Interior & Exterior

Belmas Zinc Chromate
For Interior & Exterior

Avian Zinc Chromate
For Interior & Exterior

Avian Thinner A Special
Anti-fog

Glovin Cat Kayu dan Besi
For Interior & Exterior

Lenkote Alkali Resisting Primer
Green Label Singapore

No Lumut Solvent Based
Weatherproof

No Lumut Water Based
Green Label Singapore

Sunguard All-In-One
Green Label Singapore

No Odor Medicare
Green Label Singapore

Supersilk Anti Noda
Green Label Singapore

HomeDeco Metallic
Green Label Singapore

Avitex One Coat
Green Label Singapore

Jasmine
Fast Drying

No Drop Membran
Waterproof

Avian Cat Kayu dan Besi
For Interior & Exterior

Boyo Politur Vernis Water Based
Green Label Singapore

Lenkote Wall Putty
For Interior & Exterior

Lenkote Wall Sealer
More economical topcoat usage

Avitex Plamir Tembok
Best adhesion

Aries Gold Wall Putty
Fast Drying
Giant Mortar 420 - Perekat Keramik Ekonomis
For Interior & Exterior

Suzuka Spray
Fast Drying

Suzuka Epoxy Filler
Easy to sand

Avian Thinner Super
Fast Drying

Aries Thinner Lacquer A
Fast Drying

Aries Thinner Lacquer A Special
Economical

Avian Thinner B Asli

Avian Thinner Enamel

Avitex Cat Tembok Dapur & Kamar Mandi
Green Label Singapore

Wood-Eco Woodstain Solvent Based
Waterproof
Giant Mortar L500 - Bonding Adhesive
Durable

Avitex Biocidal Wash
For Interior & Exterior

Avitex 4kids
Green Label Singapore

Everglo Kids Care
Green Label Singapore

HomeDeco Glitz
Green Label Singapore

HomeDeco Glow In The Dark
Green Label Singapore

HomeDeco Magnetic
Green Label Singapore

Avian Cat Paving
For Interior & Exterior

PRO-X 207
High Adhesion

Suzuka 2:1 PU Clear Coat
Fast Drying

Suzuka 4:1 PU Clear Coat
Fast Drying

White Brush
Brush bristles don't shed easily.

Synthetic Brush
For all types of paint

Budget Paint Roller
For Smooth and Semi-Smooth Surfaces

All Paints Paint Roller
Good Absorption

Budget Roller Cover
For Smooth and Semi-Smooth Surfaces

Regular Roller Cover
Good Absorption

All Paints Roller Cover
Good Absorption

Abrasive Paper
Waterproof

Abrasive Cloth Roll
Durable

Masking Tape
Leaves no sticky residue.

Seal Tape
Flexible

Fiberglass Tape
Flexible

Roof Drain
Durable

Avitex Cat Tembok
Fast Drying

Epoxy Bond Super Steel
Repair Materials

Epoxy Bond Super Strong
Very Strong

Grease Off
Easy to use

No Cracks
Interior

Rapid Bond
Very Strong

Rocket Bond
Fast Drying

Rust Off
Protects against rust & corrosion

Ultimate Bond
Building Materials

WoodEco Politur Interior P01
Best adhesion

WoodEco Politur Eksterior P03
For Interior & Exterior

Boyo Wood Stain Solvent Based
Best Results

Boyo Wood Filler Solvent Based
Fast Drying

Boyo Sanding Sealer NC Solvent Based
Fast Drying

Boyo Clear Coat NC Solvent Based
Fast Drying

Avitex Anti Viruz
Green Label Singapore

No Drop Tape
Waterproof

Paint Tray
100% PP Plastic

Mini Roller
Good Absorption

Mini Refill
Good Absorption

Plastic Scrapper
100% PP Plastic

No Drop Anti Panas
Green Label Singapore

Avitex Gold
Green Label Singapore

Brilliant Cat Tembok Interior
Minimal splash/splatter

Brilliant Cat Tembok Eksterior
Green Label Singapore

VIP Pengupas Cat Tembok
Water-based

Yoko Cat Dasar Kayu dan Besi
For Interior & Exterior

Avian Cling Zinc Chromate
Fast Drying

Boyo Politur Melamin
Anti-fungal & Anti-insect

Yellow Brush
Plastic handle

Avian Cling Synthetic
Fast Drying

No Drop Basic
Green Label Singapore

Aries Bling
Fast Drying

Green Brush
Good Absorption
Avitex Wizz
Green Label Singapore

PRO-X 208
Easy to stir

Boyo Politur Spray
Fast Drying

Cat Besi Anti Karat Avian 3 in 1
More economical

Basic Paint Roller
Good Absorption

No Drop Tile Grout
Waterproof

PRO-X-110
High Adhesion

PRO-X-222
High Adhesion

No Drop Plus 3in1
Waterproof

Avian Lem Epoxy Hemat
Fast Drying

Avian Cling Water Based
Fast Drying

No Drop Serat Fiber
Waterproof

No Drop Spray
Waterproof

PRO-X 111
High Adhesion

Supersilk Semi Kilap
Green Label Singapore

Giant Mortar 510 - Pengisi Nat Keramik
For Interior & Exterior

No Drop Dempul Instan
Durable

No Drop Beton dan Batu Alam
Taro Leaf Effect

No Drop Kolam Ikan
Green Label Singapore

Kran Air Taman
Durable

Boyo Wood Stain 2 in 1
Anti-fungal & Anti-insect

Avian Non-Sag Epoxy Hemat
Mercury & Lead Free

Avian Cat Lapangan
Green Label Singapore

Seal Tape Ekonomis
Economical
Giant Mortar 385 - Perekat Bata Ringan Ekonomis
Strong Adhesion
No Drop Cat Dasar 3in1
Green Label Singapore

Avitex TOP
Green Label Singapore

No Drop Anti-Leak Putty
Elastic

Basic Paint Tray Set

Paint Tray Set

Giant Mortar 265 - Acian Abu-abu Ekonomis
Perfectly Sealing Hairline Cracks

Giant Mortar 275 - Acian Putih Ekonomis
Perfectly Sealing Hairline Cracks

No Drop Kolam Ikan 2 Komponen
Elastic

Avitex Tekstur
Green Label Singapore

Supersilk Basic
Green Label Singapore

No Drop Butyl Tape Anti Bocor
Waterproof

Avian Epoxy Filler
Best adhesion

Sunguard Basic
Green Label Singapore
Avitex Wizz Cat Dasar
Green Label Singapore

No Drop Obat Cor Anti Bocor
Waterproof

Epoxy Steel 5 Menit

Epoxy Rapid 5 Menit

Epoxy Steel 2 Jam

Silicone Sealant Multi Purpose

Silicone Sealant Sanitary

Silicone Sealant Glass & Metal

Silicone Sealant Tube

Epoxy Adhesive No Filler

Non-Sag Epoxy

Lem Pipa PVC

Instant Glue

Super Glue 808

Lem Kuning Serbaguna

Lem Putih PVAc

Avian Platinum
Weatherproof
Avitex 510 Wall Sealer & Alkali Primer
Green Label Singapore
Avitex 520 Wall Sealer & Alkali Primer
Green Label Singapore
Avitex 540 Wall Sealer & Alkali Primer
Green Label Singapore

Giant Mortar 225 - Plamir Instan Ekonomis
For Interior & Exterior

Avian Cling 2in1
Protects against rust

Avian Cling Primer
Preventing Rust

Cloth Tape
Easy to apply

Honeycomb Paint Roller
Good Absorption

Velcro Sanding Disc
Easy to Install

Eco Paint Roller
Good Absorption

Economical Water Faucet
Easy to Install

Iron Water Faucet
Brass Ball

No Drop Acian Anti Bocor
Waterproof
Avian Epoxy Serbaguna
Best adhesion

Avitex Metallic
Green Label Singapore

Double Foam Tape
Flexible

OPP Tape Brown
Flexible

OPP Tape Clear
Flexible

Vinyl Electrical Tape
Strong Adhesion

Plastic Cover
Flexible

Abrasive Cloth Roll Eco
Durable

Jet Shower Set
Durable

Shower Hose
Durable

Jet Shower
Durable
Avian Aluminium Paint
Fast Drying
No Drop Pencampur Semen Multifungsi
Waterproof

avian brands sustainability strategy
SUSTAINABILITY REPORTING STANDARDS
| Metric | 2025 | 2024 | 2023 |
|---|---|---|---|
| Financial Services Authority Regulation No. 51/POJK.03/2017 | Yes | Yes | Yes |
| Global Reporting Initiative ("GRI") Standards | Yes | Yes | Yes |
| Sustainability Accounting Standards Board ("SASB") - Chemical Standards | Yes | Yes | No |
| Climate Disclosure Standards Board ("CDSB") | Yes | Yes | No |
| Task Force for Climate-related Financial Disclosures ("TCFD") | No | Yes | No |
CLIMATE RISK REPORTING STANDARDS
| Metric | 2025 | 2024 | 2023 |
|---|---|---|---|
| International Financial Reporting Standards ("IFRS") S2 Climate-related Disclosures | Yes | No | No |
COMPANY OVERVIEW
| Metric | 2025 | 2024 | 2023 | |
|---|---|---|---|---|
| Company | Total Asset (IDR Million) | 11,084,379 | 11,060,975 | 11,166,987 |
| Net Revenues (IDR Million) | 8,123,685 | 7,471,356 | 7,016,882 | |
| Profit for the Year (IDR Million) | 1,744,020 | 1,663,699 | 1,643,096 | |
| Total Number of Employees (People) | 9,330 | 9,322 | 8,483 | |
| Total Manufacturing Facilities (Manufacturing Plants) | 2 | 2 | 2 | |
| Distribution Centers | 182 | 177 | 172 | |
| Number of Customers | 60,109 | 58,600 | 56,878 | |
| International Certification | ISO 9001 Quality Management System (QMS) | Yes | Yes | Yes |
| ISO 45001 Occupational Health and Safety Management System (OHSMS) | Yes | Yes | Yes | |
| ISO 14001 Environmental Management System (EMS) | Yes | Yes | Yes | |
| ISO 50001 Energy Management System (EnMS) | Yes | Yes | Yes | |
| ISO 27001 Information Security Management System (ISMS) | Yes | Yes | Yes | |
| Sustainability Rating | Sustainalytics | Low Risk | Medium Risk | Medium Risk |
| Ecovadis | Silver | Silver | Silver |
PRODUCT PILLARS
| Metric | 2025 | 2024 | 2023 | |
|---|---|---|---|---|
| Water-based Products | Ratio of Water-based Products | 83.1% | 82.2% | 81.5% |
| Green Label Singapore | Number of Certified Products | 40 | 34 | 29 |
| Revenue Contribution (as % of the Architectural Solutions) | 24.4% | 23.7% | 11.4% |
ENVIRONMENT PILLARS
| Metric | 2025 | 2024 | 2023 | |
|---|---|---|---|---|
| General Environment | ISO 14001 Certified Manufacturing Facilities | 100.0% | 50.0% | 50.0% |
| ISO 50001 Certified Manufacturing Facilities | 100.0% | 100.0% | 100.0% | |
| Environmental Management Policy | Global Environment, Health and Safety, Energy Policy | |||
| Emissions | Scope 1 Direct Emissions from Stationary Combustion (TonCO2e) | 2,280 | 2,507 | 2,511 |
| Scope 1 Direct Emissions from Mobile Combustion (TonCO2e) | 212 | 211 | 251 | |
| Total Scope 1 GHG Emissions (TonCO2e) | 2,492 | 2,718 | 2,762 | |
| Scope 2 Indirect Emissions from Consumption of Electricity Purchased from PLN (TonCO2e) | 7,245 | 8,565 | 8,582 | |
| Total Scope 1 and 2 GHG Emissions (TonCO2e) | 9,736 | 11,283 | 11,344 | |
| Upstream Transportation and Distribution (TonCO2e) | 766 | 603 | - | |
| Downstream Transportation and Distribution (TonCO2e) | 8,397 | 8,112 | - | |
| Use of Products Sold (TonCO2e) | 51,601 | 54,342 | - | |
| Total Scope 3 GHG Emissions (TonCO2e) | 60,764 | 63,057 | - | |
| Emissions Reduction Goal | Reduce absolute Scope 1 and 2 emissions by 50% by 2030 (2021 baseline) | |||
| Emissions Reduction Strategies | See page 97-100 of our 2025 Sustainability Report | |||
| Materials | Renewable Materials (Ton) | 117,436 | 89,589 | 72,903 |
| Ratio of Renewable Material Usage (%) | 56.6% | 56.3% | 50.7% | |
| Renewable Materials Strategies | See page 88-89 of our 2025 Sustainability Report | |||
| Energy | Electricity Consumption - Indirect Scope 2 (GJ) | 48,923 | 53,111 | 51,149 |
| Fuel Oil (Diesel) Consumption - Direct Scope 1 (GJ) | 2,872 | 2,858 | 3,406 | |
| Gas Consumption - Direct Scope 1 (GJ) | 39,554 | 43,496 | 43,561 | |
| Total Non-Renewable Energy Usage (GJ) | 91,349 | 99,464 | 98,116 | |
| Renewable Energy Usage (GJ) | 9,373 | 2,013 | 1,815 | |
| Total Energy Usage (GJ) | 100,722 | 101,477 | 99,931 | |
| Renewable Energy Percent of Total (%) | 9.3% | 2.0% | 1.8% | |
| Renewable Energy Strategies | See page 93 of our 2025 Sustainability Report | |||
| Water | Total Water Usage (m³) | 186,114 | 137,543 | 137,772 |
| Intensity of Water Usage (m³/Ton Product) | 0.99 | 0.75 | 0.81 | |
| Ratio of Industrial Wastewater Recycle (Liter/Ton of Water-Based Products) | 5.05 | 4.86 | 5.06 | |
| Waste | Total Generated Waste (Hazardous and Non-Hazardous) (Ton) | 6,513 | 5,330 | 2,936 |
| Ratio of Total Waste Reused (Hazardous and Non-Hazardous) (Ton) | 100.0% | 100.0% | 100.0% | |
| Waste Reduction Strategies | See page 102-104 of our 2025 Sustainability Report | |||
PEOPLE & COMMUNITY PILLARS
| Metric | 2025 | 2024 | 2023 | |
|---|---|---|---|---|
| Workforce | Women in Workforce | 23.3% | 22.6% | 20.3% |
| Women in Management (Senior-Executive Level) | 14.1% | 14.6% | 14.3% | |
| Workforce Age Group 18 - 24 Years Old | 15.0% | 17.2% | 17.4% | |
| Workforce Age Group 25 - 34 Years Old | 52.8% | 52.0% | 51.3% | |
| Workforce Age Group 35 - 44 Years Old | 24.8% | 24.1% | 24.8% | |
| Workforce Age Group 45 - 54 Years Old | 6.6% | 6.0% | 6.0% | |
| Workforce Age Group >55 Years Old | 0.8% | 0.7% | 0.6% | |
| Turnover of Permanent Employees | 1.9% | 2.3% | 1.5% | |
| Training | Total Employees | 9,330 | 9,316 | 8,477 |
| Total Training Hours | 125,555 | 144,529 | 128,278 | |
| Average Training Hours per Employee | 13.46 | 15.51 | 15.13 | |
| Occupational Health and Safety | Lost Time Injury Rate (LTIR) | 0.27 | 0.00 | 0.00 |
| Total Recordable Injury Rate (TRIR) | 0.80 | 0.81 | 0.57 | |
| Health and Safety Policy | Global Health, Safety, and Environment Procedure | |||
| Human Rights and Fair Employment | Policy against Child Labor and Forced Labor | Business Partner Ethic | ||
| Policy on Respect of Human Rights | Business Ethic & Code of Conduct | |||
| Anti-Harassment and Non-Discrimination Policy | Human Rights Impact Assessment and Work Instruction of Human Right Risk Assessment | |||
| Corporate Social Responsibility (CSR) | Total Program Activities | 264 | 195 | 98 |
| Total Allocated Funds (IDR Million) | 5,253 | 2,344 | 1,995 | |
GOVERNANCE PILLARS
| Metric | 2025 | 2024 | 2023 | |
|---|---|---|---|---|
| Ethics | Business Ethics Policy | Business Ethic & Code of Conduct | ||
| Board of Directors | Size of the Board | 5 | 5 | 5 |
| Independent Directors on Board | 40.0% | 40.0% | 40.0% | |
| Gender Diversity | 20.0% | 20.0% | 20.0% | |
| Board Meetings Held | 12 | 12 | 12 | |
| All Directors Attended ≥ 75% of Meetings | Yes | |||
| Independent Members on the Audit Committee | 100.0% | 100.0% | 100.0% | |
| Audit Committee Meetings | 5 | 5 | 6 | |
| Independent Members on the Nomination and Remuneration Committee | 33.3% | 33.3% | 33.3% | |
| Nomination and Remuneration Committee Meetings | 3 | 3 | 3 | |
| Independent Members on the Good Corporate Governance Committee | - | - | - | |
| Good Corporate Governance Committee Meetings | 4 | 4 | 3 | |
| Shareholders Practices | Equal Voting Rights (One Vote per Share) | Yes | ||
| Shares Outstanding as of December 31 | 59,312,728,400 | 60,790,106,400 | 61,918,936,800 | |
| Majority Voting Standard | Yes | |||
| Public Policy and Political Engagement | Political Action Committee | No | ||
| Public Policy and Political Engagement Statement | 2025 Sustainable Policy | |||
| Remuneration(1) | Total Remuneration Received by Executives(2) (IDR Million) | 98,303 | 92,910 | 88,421 |
| Governance | Total Executives(2) | 8 | 7 | 7 |
| Female Executives(2) | 12.5% | 14.3% | 14.3% | |
| Sustainability Report Assurance | Decar Verite Asia (Moderate Level) | Decar Verite Asia (Moderate Level) | No | |
| External Auditor | KAP Teramihardja, Pradhono & Chandra (A Member Firm of Crowe Global) | KAP Teramihardja, Pradhono & Chandra (A Member Firm of Crowe Global) | KAP Tanudiredja, Wibisana, Rintis & Rekan (A Member Firm of PwC global network) | |
| Audit and Audit-Related Fees Paid to Auditor (IDR Million) | 770 | 700 | 1,250 | |
| Non-Audit Fees Paid to Auditor (IDR Million) | - | - | - | |
Penilaian Kinerja Keberlanjutan Avian Brands
Skor Morningstar Sustainalytics
Memperoleh skor Low Risk Morningstar Sustainalytics

Medali Silver Medal EcoVadis
Peningkatan skor EcoVadis dari 67/100 menjadi 76/100

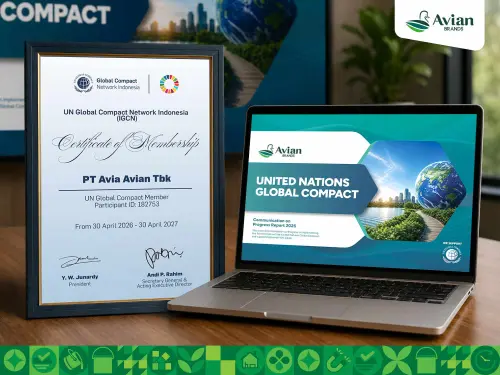
United Nations Global Impact (UNGC)
Avian Brands bergabung sebagai anggota UNGC dan menyelaraskan strategi dan operasional perusahaan dengan Ten Principles UNGC, serta berkontribusi pada pelaporan Communication on Progress (COP) sebagai bentuk akuntabilitas tahunan atas implementasi prinsip-prinsip UNGC.

Bursa Efek Indonesia
Saham PT Avia Avian Tbk masuk dalam 45 saham terbaik Bursa Efek Indonesia versi Indeks ESG Quality 45 IDX KEHATI (ESGQKEHATI), 55 dengan kinerja ESG di atas rata-rata versi Indeks ESG Sector Leaders IDX KEHATI (ESGSKEHATI), 25 saham terbaik versi Indeks SRI-KEHATI, dan 85 saham terbaik versi IDX ESG Leaders.
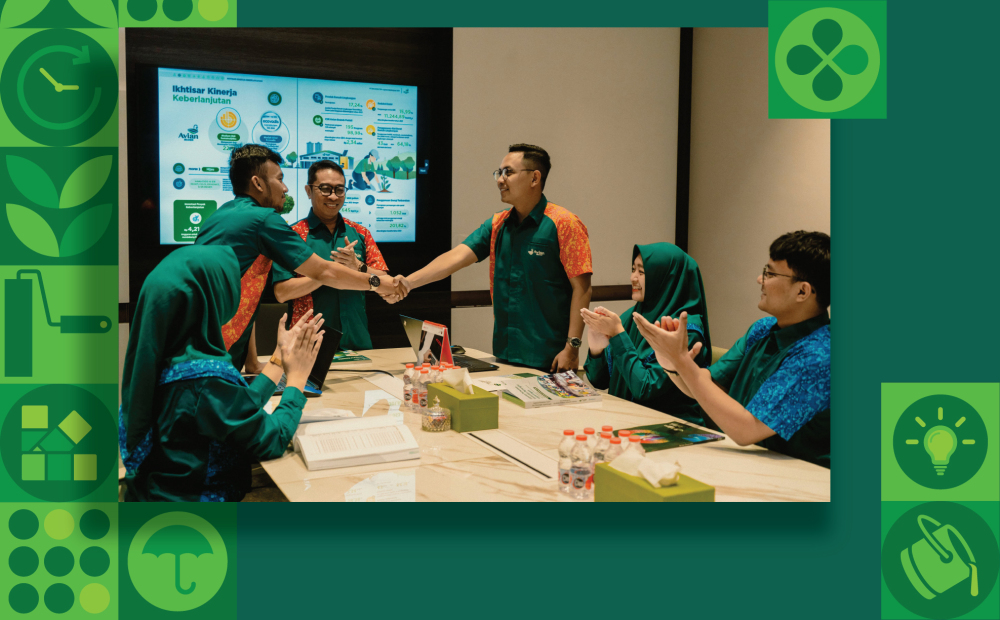
Avian Brands Peduli
Sustainability in Action
Avian Brands berkomitmen untuk meningkatkan taraf hidup dengan membangun bisnis yang memiliki dampak positif bagi masyarakat kini dan nanti yang kami salurkan melalui Avian Brands Peduli, sebuah wadah tanggung jawab sosial terhadap dunia pendidikan, lingkungan, dan aksi tanggap bencana.
View All Articles
Mendukung Agenda Global untuk Bisnis Berkelanjutan: Avian Brands Susun CoP UN Global Compact
30 Juni 2026
Avian Brands Perkuat Posisi sebagai Pemimpin ESG di Industri Cat Indonesia melalui Pengakuan dari Indeks KEHATI dan Bursa Efek Indonesia
24 Juni 2026
Avian Brands Resmi Menerbitkan Climate Risk Report Perdana Berbasis IFRS S2
08 Juni 2026
Connect With Us


Download the App
© Avian Brands 2026